


It’s time to automate your workflow and take full control of your experience.
Too often, any sort of update or check on a remote asset or site requires a physical presence interfacing on location. Even if there are remote monitoring capabilities, significant changes to operations are often a tedious undertaking.
Moreover, even if you perform these tasks onsite, there is always the risk of human error. What if these tasks could be pre-programmed as rules and automated commands that can be performed without as much as a button click?
What if you could have full control over your visualizations and dashboards, making sure only the information you need is displayed?
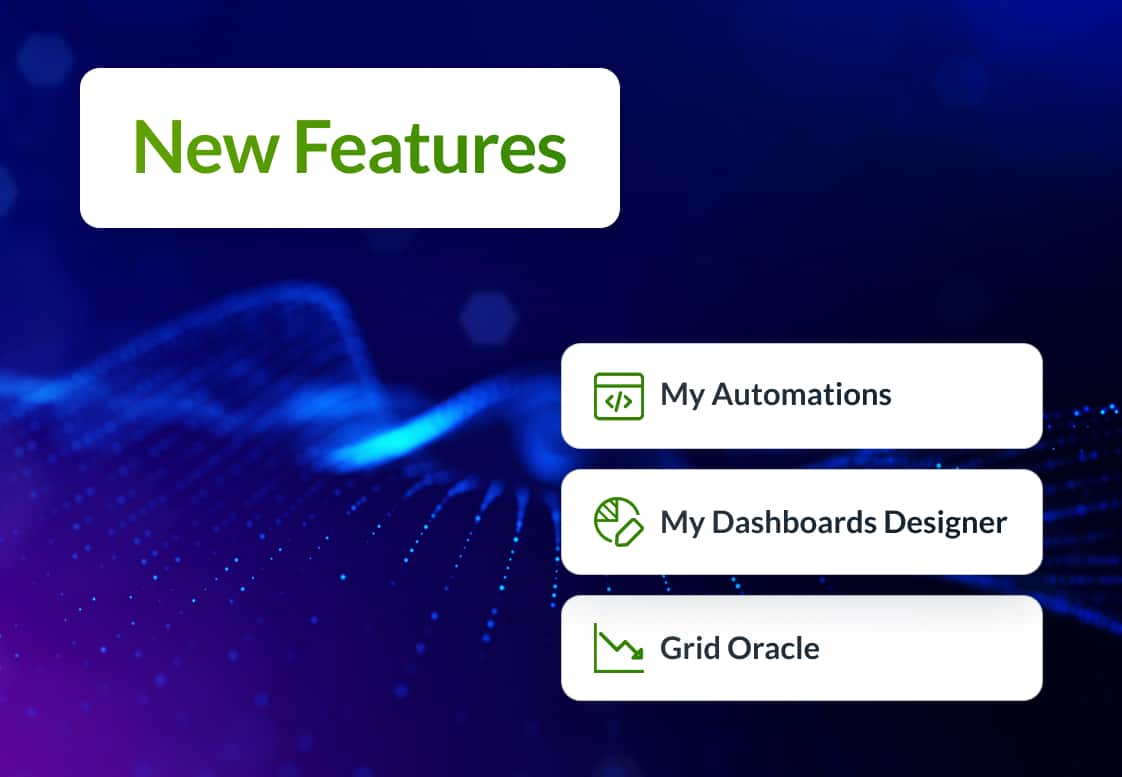
Our latest batch of releases is about giving complete and advanced control capabilities over their user experience and streamlining operational processes through automation – Introducing My Automations, Dashboards Designer, and Galooli Oracle.
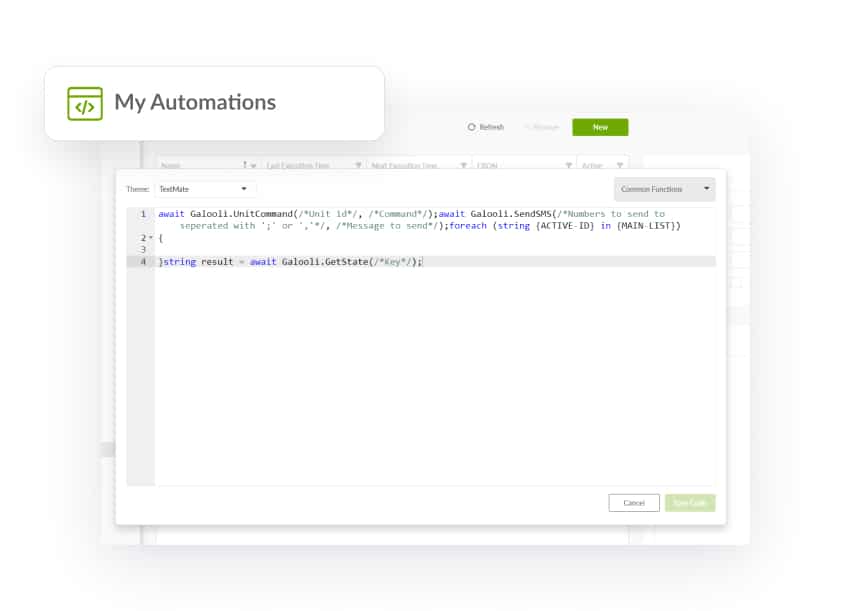
My Automations provides an interface to create, test, and run your personalized, organization-specific actions. This can range from turning on battery storage after “X” hours that a generator is running, or pushing updates to multiple assets and sites with a single string. You can also create specialized automatic alerts, beyond those existing within the system, tooled to your exact needs.
These automations can also be set up to run on their own, or as a button feature that can perform a string of commands with a single click. It’s time to take your operations completely into your own hands, and create your own optimized, automated workflow for your organization.
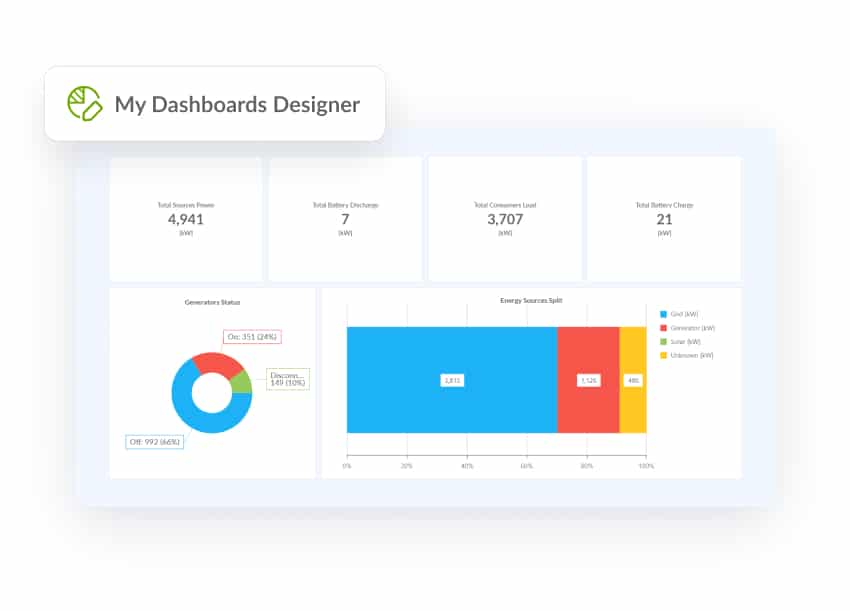
Galooli wants to make sure that our clients have the tools to organize and display the exact information they need for their operations and management. For that reason, we created our Dashboards Designer.
Designer provides an organized space to choose and organize which KPIs you track, how they are displayed, and the parameters of data display, among many other customizations. These dashboards can also be shared throughout an organization to create a streamlined system, or even with other organizations.
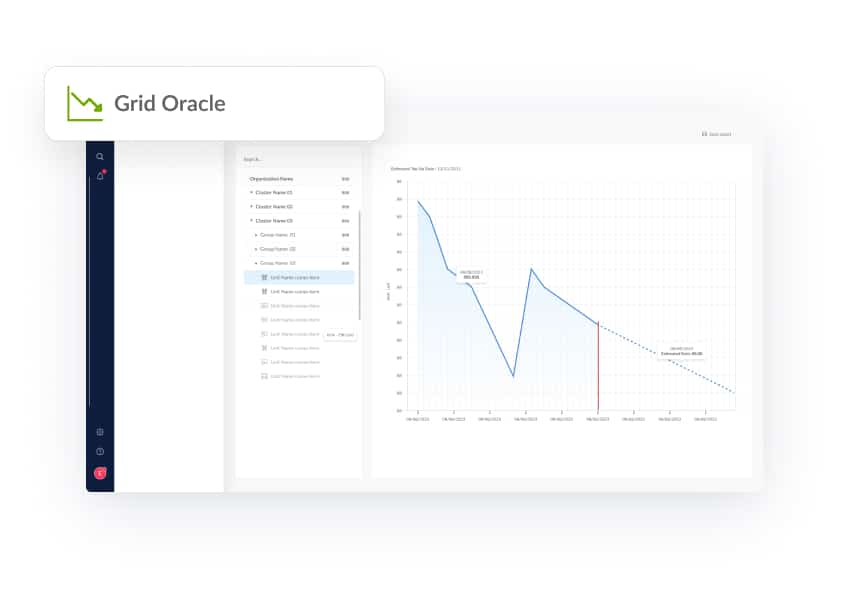
Maintaining remote site uptime always carries some element of the unknown. By tracking power use over time, organizations can create a more accurate picture of their resource needs, but that is not always enough.
Galooli’s new Grid Oracle provides grid use forecasting to help site operators be prepared in advance and avoid unnecessary additional payments or running out of power early. This feature analyzes all of your remote assets, and ranks those that are most in need of extra grid credits, and which ones are the most energy-efficient. The Grid Oracle uses graph visualizations to track usage, and display forecasts along with the expected leftover credits.
Looking back while pushing forward
Efficiency is everything, from energy management to workflow. Our customers need the capability to streamline their processes and focus their energies on tasks that still require manual intervention. These upgrades to Galooli’s solution provide that level of customization and create a basis to give users complete control over their experience.