


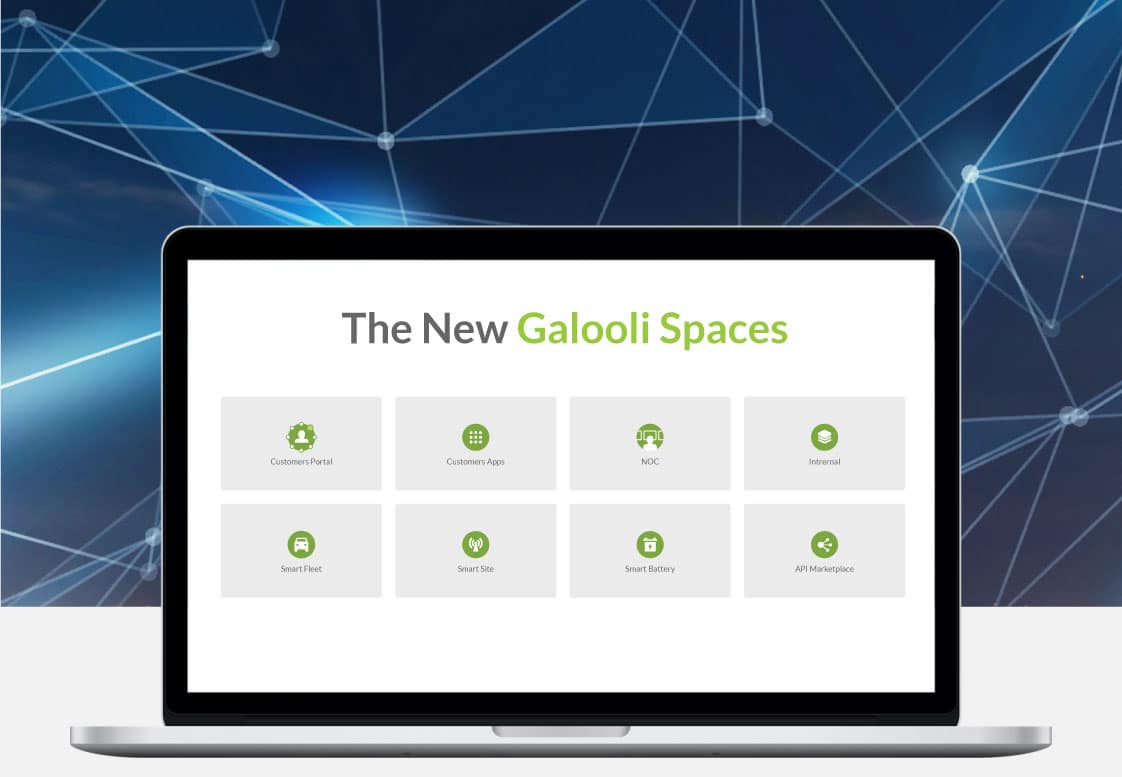
- Galooli redesigned its primary platform to make it more user friendly than ever.
- The new platform—Galooli Spaces—is a web-based system that includes an upgraded version of Galooli’s most popular industrial IoT and predictive analytics features.
- The Fleet Space is divided into three multidimensional tabs.
- Deep Dive allows to reconstruct vehicles’ route(s) during a selected time range.
Have you ever experienced an interface or an app that not only makes sense, but even exceeds your expectations: one that is fast, simple, productive, and fun?
Creating an elevated user experience of this sort—a UI that makes you say, “wow, that’s great!”—is an ambitious technological challenge that we at Galooli welcome.
We believe in simplicity. The simpler our solutions, the more value we provide to our users. Years after launching the ZON Max, which used to be our primary platform, we redesigned the system to make it more user friendly than ever. Based on feedback from, and rigorous analysis of Galooli’s extensive customer base, we reconstructed the platform. It is now made of designated spaces—Galooli Spaces—which are extremely easy to navigate. We basically reworked the previous system from the customer experience to the technology. We focused on what our users most need, use, and like. Anything beyond that is a means to this end.
Sometime Less is More
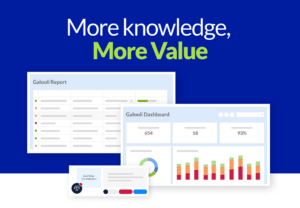
Galooli Spaces include new interactive maps, charts, and graphs. Each one of them vividly demonstrates the data our system collects and analyzes via cutting edge AI technology. However, the changes we’ve made to the previous system are, in essence, technological, and go beyond graphics and visualizations.
Unlike ZON Max, which is a desktop–based application, Galooli Spaces is a a web-based system. Installation and updates do not require of users any action whatsoever. Also, the spaces include an upgraded version of our best Industrial IoT and predictive analytics features. While some of them are included in the ZON Max, others are totally new. Unlike the ZON, which includes hundreds of features and tens of report and dashboard-templates, Galooli Spaces is more focused, making its navigation and operation easier, more enjoyable, and productive.
Over the years, we’ve provided services for hundreds of thousands of subscribers from five continents. We have continually added features based on our customers’ needs and requests. At the same time, we were able to identify usage patterns, and profile a set of core services that are either universal for all our users, or unique to specific industries.
The new Galooli Spaces include these sets of services, making any extra features optional. As much as the new spaces are simple and precise, they are also flexible and easy to configure and reconfigure. Adding and omitting features requires no more than a handful of clicks on one screen.
“The first space we launched is the Fleet Space, which provides fleets managers and end users a fast and simple way to know everything they need to know in real-time, or retroactively, about their fleet”
First Comes Fleet
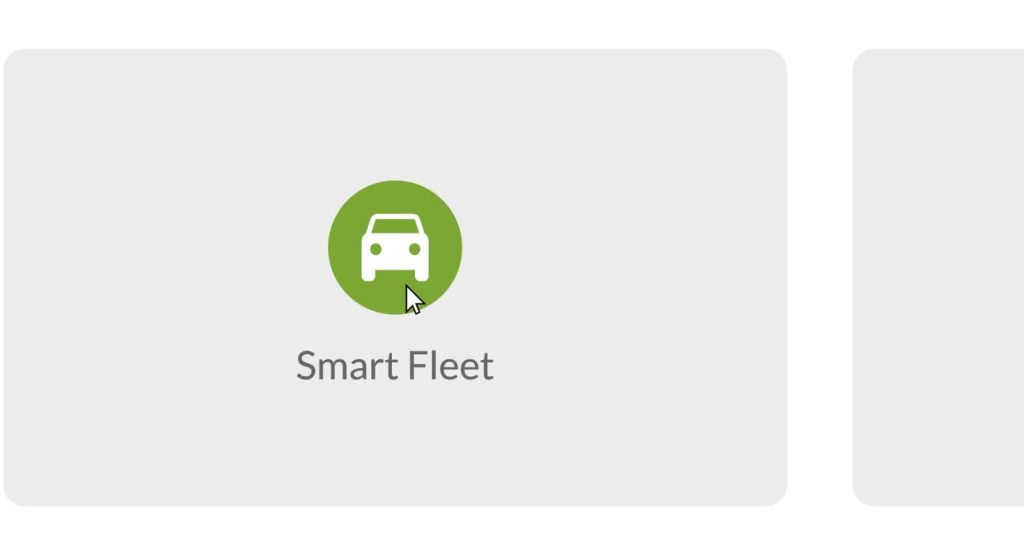
Galooli is a SaaS (Solution as a Service) company that specializes in monitoring, tracking and remote management of connected assets of three main industries: Telecom, batteries, and vehicles fleets. Each one of these industries receives a space of its own. The first space we launched is the Fleet Space, which provides fleets managers and end users a fast and simple way to know everything they need to know in real-time, or retroactively, about their fleet. The space is divided into three main tabs: Map View, Reports, and Events.
Map View
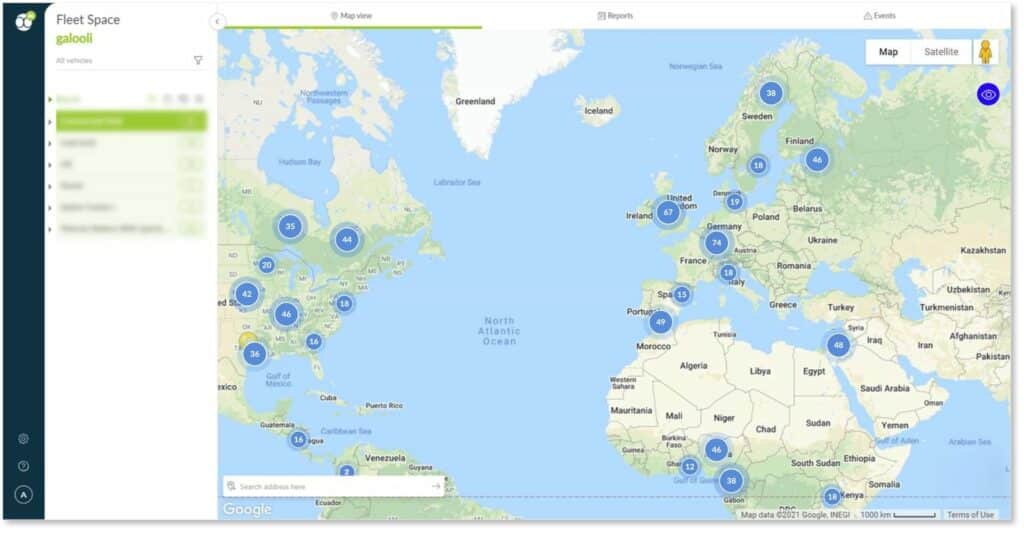
This tab includes an interactive google map, which provides essential data pertaining to the vehicles’ location and status. If you’d like to know, for example, where a certain car is—whether it’s in or out of a geofence that you set—whether it’s in motion or in off mode, whether it is connected, idling, or suffers from a technical malfunction, Map View is your tab. A quick look at the map, and the integral Data Window it includes, will answer these and additional questions about the vehicles’ speed, fuel level, battery health, and engine status.
To assure maximum flexibility, the Fleet Space is multidimensional. Structurally, it allows users to explore either the entire fleet or specific groups and units. Geographically, the map is interactive. Other than zooming in and out, it gives the option of geofencing designated areas, and marking points of interest according to users’ needs. Chronologically, the map gives the option of making a Deep Dive, and exploring both real-time and past activity.
Reports
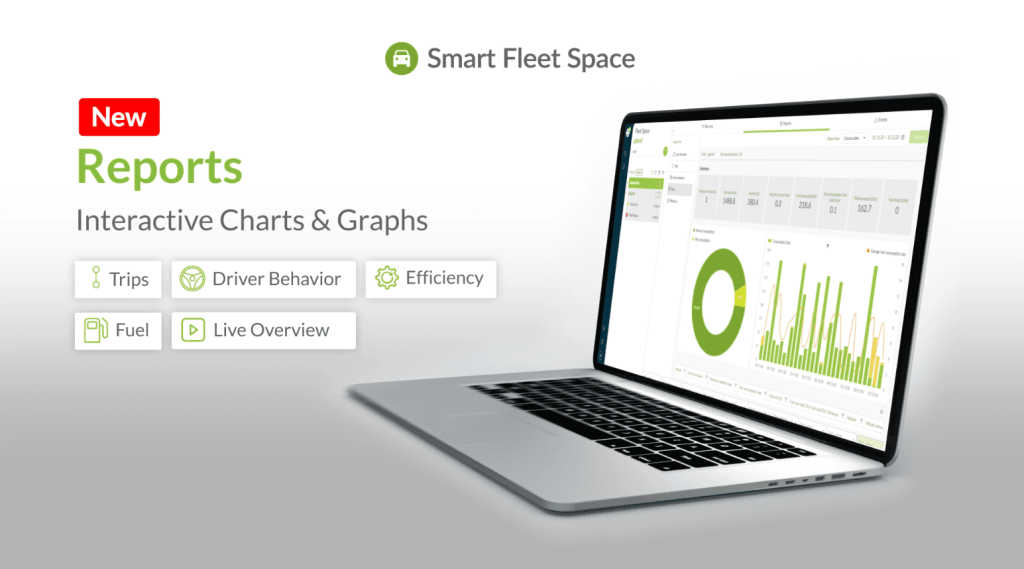
Going through detailed operational and managerial accounts does not have to be burdensome. The reports included in the Fleet Space are designed to give users a productive, simple, and enjoyable experience, grounded in the most relevant and precise facts fleet managers could ask for. The Report List included in the Fleet Space is made up of five templates: Live Overview, Trips, Driver Behavior, Fuel and Efficiency. Each one of them focuses on a crucial aspect of remote fleet management. Together, they provide a comprehensive picture pertaining to the fleet’s deployment, operation, and status.
The organizing principle that stands at the basis of the reports is maximum visualization combined with minimum written text. Each report includes three main elements:
- A summary box that includes essential information about all the vehicles the report focuses on.
- Interactive charts and graphs that demonstrate key fields and factors.
- A data table that lists specific details about each vehicle.
Other than being easily configured and filtered, the reports can easily be exported to external platforms.
Events
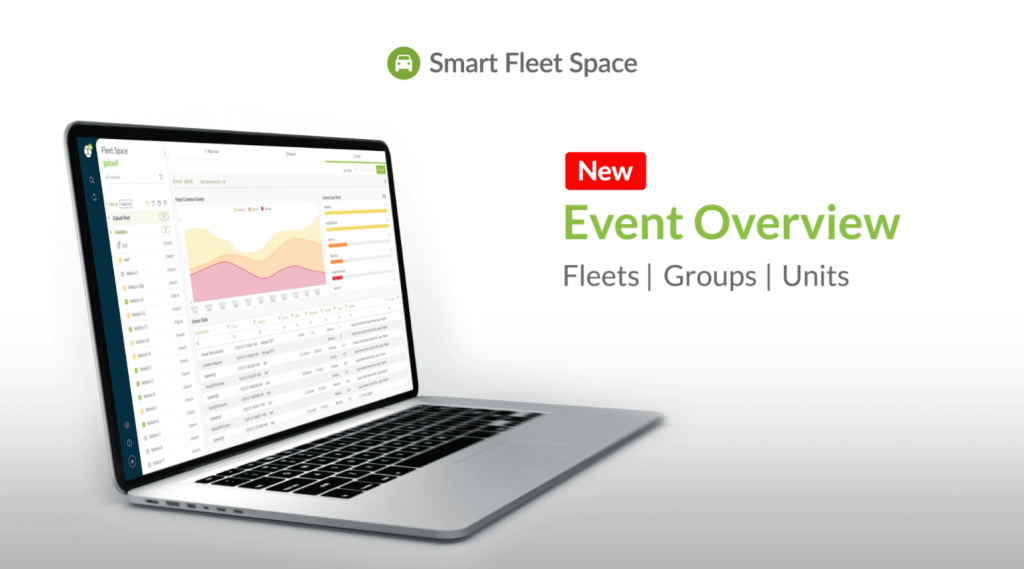
One click on the Events tab provides a comprehensive overview and analysis of all the events that took place in a selected time range. Any safety, technical, or operational issue associated with either a vehicle or driver behavior is recorded, listed, and presented according to its severity level, time of occurrence, and location.
The tab consists of three main elements. First, an Event Count Box that presents all events by their thematical category. This could be anything associated with driving behavior, maintenance, licensing, power control, and more. While the default Events List is long and detailed, users can configure it independently, and name events according to their own preferences. The second element is a timeline that presents the most common events by their time of occurrence and severity level, which proceeds from advisory, to caution, to warning. Finally, an Event Table details each event according to a variety of criteria including speed, driver, address, and more. As in the case of reports, here too each piece of information can be easily filtered, sorted, and exported.
Bonus: Deep Dive
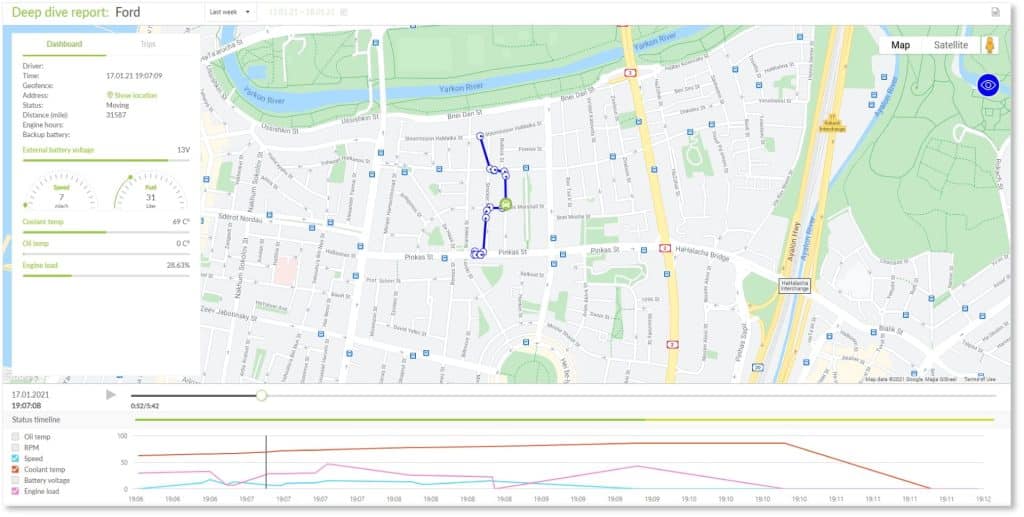
As much as Product and R&D personnel have asked me not to use this word to describe this tab—they argue that it’s too informal—Deep Dive is c-o-o-l! What does it do?
The tab allows exploration of different time units, which range from the previous day to the previous week. Once set, the system will reconstruct the vehicles’ route(s) during the selected time range, and provide relevant data (e.g. speed, RPM, coolant temp) on each point along the way. To make the tracking process even more visual and straightforward, the tab includes an interactive status timeline, which users can pause, replay, or fast forward at any point. Tracking and monitoring a vehicle was never easier nor more accurate.
A Few Words of Love
We really don’t want to sound overly nostalgic. However, to all of you folks who are worried about the good old ZON Max, we’d like to send a word of reassurance. The ZON has been with us for quite a while. It has treated us, and our users more than well. On our end, we continued to invest in its maintenance and development. Now it’s almost time to say goodbye.
The launch of the Fleet Space marks for the ZON the beginning of the end. But we are too attached to it to simply say shalom. For the time being it remains as active as ever. Even after we announce its termination, we will reserve a place of honor for the ZON in Galooli’s Cyberspace. There it shall forever shine and orbit its successors—the new Galooli Spaces—gloriously and peacefully to the end of days.